In today’s fast-paced software landscape, organizations are turning to DevOps to streamline and accelerate delivery. But how do you know if your DevOps practices are truly effective? The answer lies in performance metrics. In this article, we’ll break down the most important DevOps performance metrics and share practical, hands-on tips to optimize your software delivery process—without getting lost in too much technical jargon.
What Are DevOps Performance Metrics?
DevOps performance metrics are quantitative measures that help you understand how well your development and operations teams are working together. Think of them as the “health indicators” of your software delivery process. Just like you might track your heart rate or step count to gauge your fitness, these metrics provide insights into the efficiency, quality, and speed of your software development pipeline.
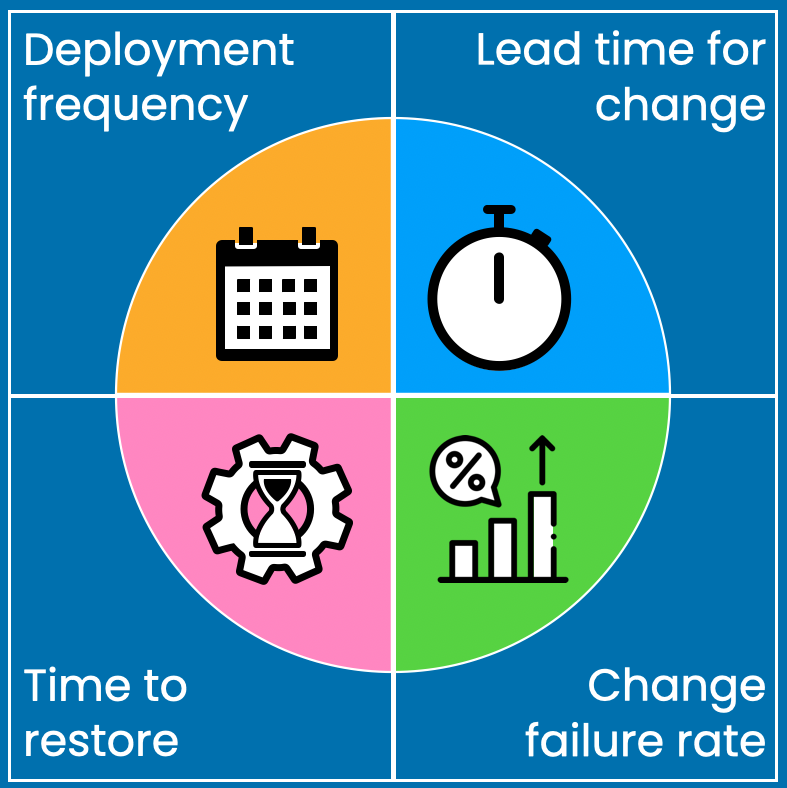
Key Metrics to Track
Here are four core metrics that many successful teams monitor:
1. Deployment Frequency
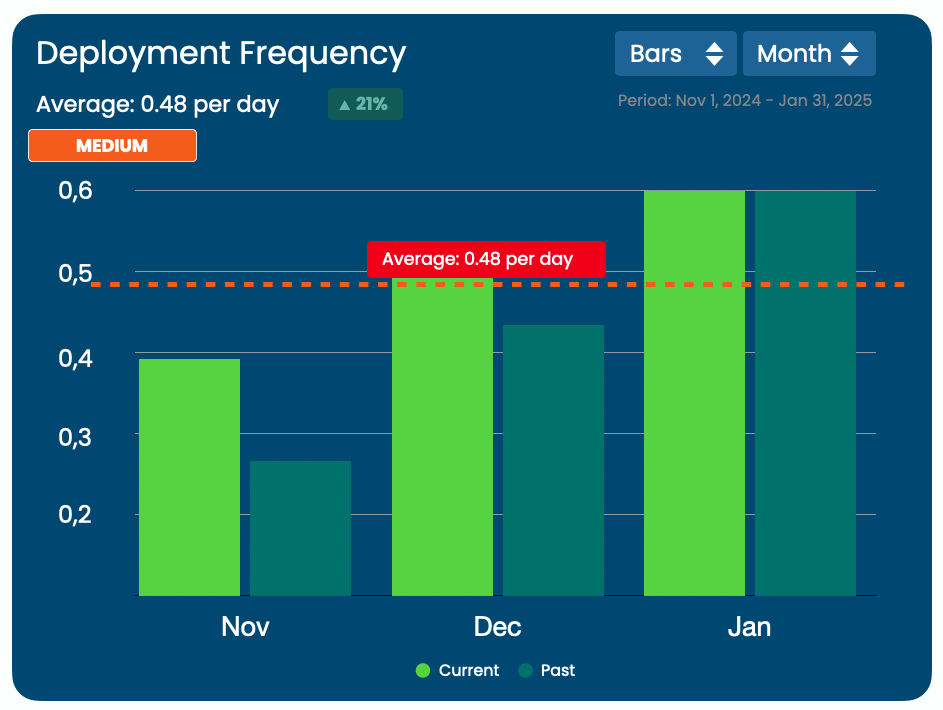
What It Is:
Deployment frequency tracks how often your team successfully releases new code to production.
Why It Matters:
Frequent deployments often indicate a healthy process where changes are small, manageable, and regularly reviewed. This reduces the risk of major failures since each change is incremental.
Practical Tip:
Break Down Features: Encourage your team to release smaller, iterative updates rather than large batches of changes. This makes it easier to pinpoint issues and maintain high quality.
2. Lead Time for Changes
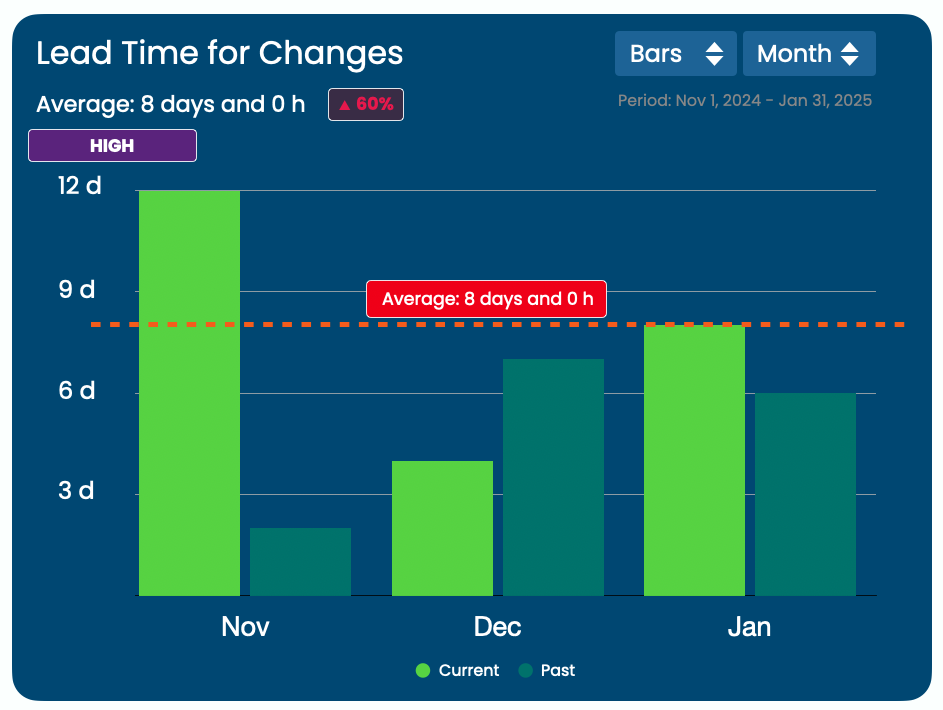
What It Is:
Lead time for changes measures the time it takes from a code commit (when a developer makes changes) to the moment that change is live in production.
Why It Matters:
Shorter lead times mean that your team can quickly respond to customer needs or fix issues. It’s a great indicator of how agile your process is.
Practical Tip:
Automate Testing & Deployment: Implement automated testing and continuous integration/continuous deployment (CI/CD) pipelines (tools like GitLab CI/CD are great here) to reduce manual delays.
3. Mean Time to Restore (MTTR)
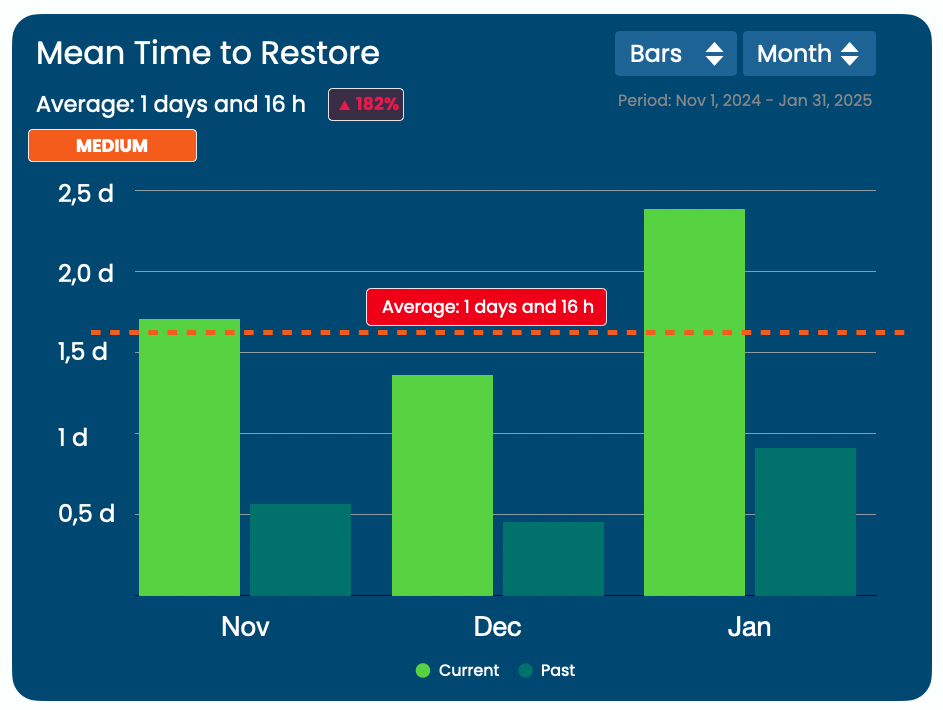
What It Is:
MTTR is the average time it takes to recover from a failure in production—such as when an error or outage occurs.
Why It Matters:
A lower MTTR means your team is effective at quickly addressing issues and minimizing downtime, which is critical for maintaining user trust and service quality.
Practical Tip:
Implement Robust Monitoring: Use monitoring tools (like Prometheus or Datadog) to detect issues early and set up clear escalation paths so that your team can act swiftly when problems occur.
4. Change Failure Rate
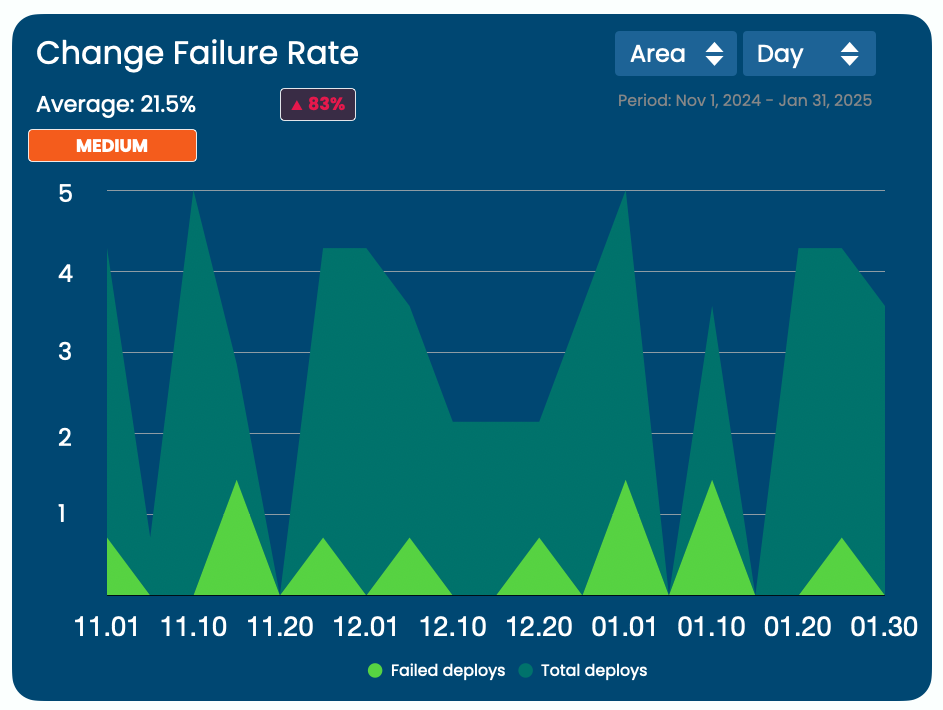
What It Is:
Change failure rate is the percentage of deployments that cause a failure in production. This could be a bug, a service outage, or any significant error.
Why It Matters:
A lower failure rate indicates that your code changes are reliable and that your testing and review processes are robust.
Practical Tip:
Enhance Code Reviews: Strengthen your code review processes by encouraging pair programming or using automated static code analysis tools to catch errors before they reach production.
Understanding the DORA Metrics with Benchmark Table
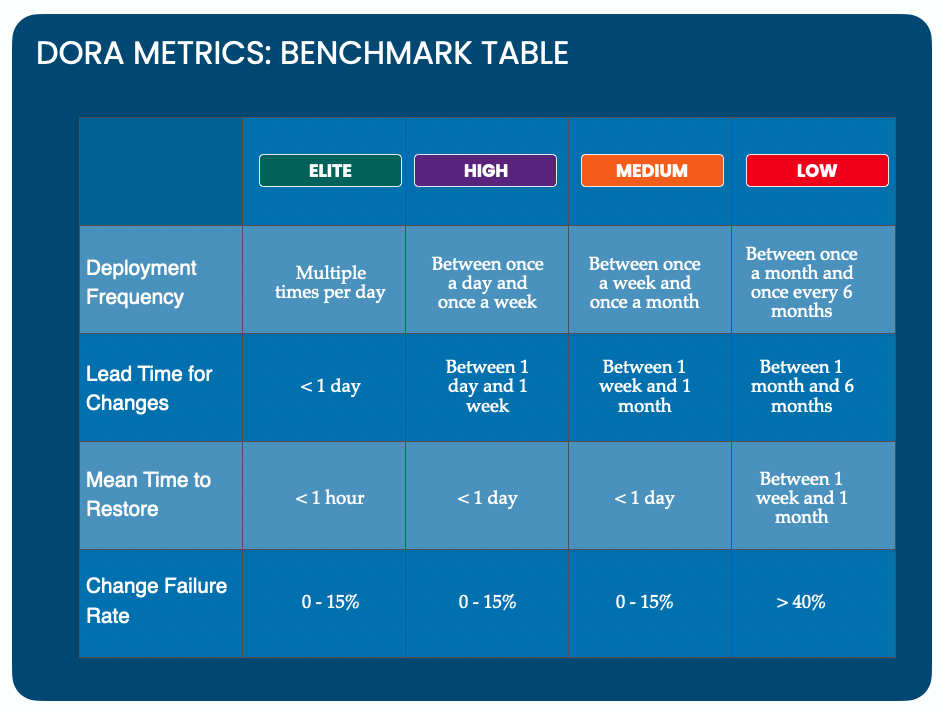
The DORA Metrics Benchmark helps engineering teams assess their software delivery capabilities and compare them against industry standards. By tracking these metrics, teams can identify inefficiencies, optimize workflows, and drive continuous improvement in deployment speed, stability, and reliability.
How to read the table:
The table categorizes teams into Elite, High, Medium, and Low performers based on four key factors: Deployment Frequency, Lead Time for Changes, Mean Time to Restore (MTTR), and Change Failure Rate. These benchmarks help organizations pinpoint weaknesses, set realistic goals, and prioritize DevOps investments for better software delivery, and identify improvement areas.
Practical Tip:
Start by tracking your current performance across these four metrics. Identify one key area for improvement, such as reducing lead time by automating testing, and iteratively enhance your DevOps practices over time.
Making Metrics Work for You
While these metrics provide valuable insights, they’re only as good as the actions you take based on them. Here are a few practical strategies to optimize your software delivery:
- Set Clear Baselines: Start by establishing current performance levels. Measure where you are today so you can set realistic improvement targets.
- Leverage Dashboards: Use dashboards (many CI/CD tools offer this) to visualize your metrics in real time. This helps everyone on the team understand performance trends and areas needing attention.
- Foster a Culture of Continuous Improvement: Encourage your team to review these metrics regularly. Hold retrospectives to discuss what’s working and what isn’t. Remember, it’s not about assigning blame but about finding ways to improve together.
- Integrate Feedback Loops: Automate feedback where possible. For instance, if a deployment fails, set up alerts that immediately inform the responsible team members so that the issue can be quickly addressed.
Final Thoughts
By focusing on these key DevOps performance metrics—lead time for changes, deployment frequency, mean time to restore, and change failure rate—you can gain actionable insights into your software delivery process. Implementing practical strategies such as automating tests, enhancing code reviews, and utilizing real-time dashboards will help you not only track these metrics but actively improve them.
Start by measuring where you are today and set incremental goals for improvement. Over time, these small changes can lead to significant enhancements in your delivery process, ensuring that your team can quickly adapt to challenges while maintaining high standards of quality and reliability.
Remember, the goal isn’t to overwhelm your team with data but to use it as a tool for continuous improvement and success.
Happy optimizing!